The transformer winding deformation tester is used for power transformer with voltage grade of 6kV and above and other transformers with special purpose. The power transformer is inevitably vulnerable to impulse of various fault short-circuit current or physical collision in the process of operation and transportation and the transformer windings may lose stability under the powerful electro-dynamic force exerted by such short-circuit current, which could result in permanent deformations such as local distortion, swell or dislocation and will severely affect safe operation of the transformer. Deformation of transformer windings is measured with frequency response analysis method according to national standard DL/T911-2016 for electric power industry, i.e. detect amplitude-frequency response characteristic of each transformer winding and make vertical or horizontal comparison of the detection result to judge possible deformation of the transformer winding based on change of amplitude-frequency response characteristics.
1.Main Technical Characteristics
1) Characteristics of transformer windings are measured with frequency sweep method. Deformations of windings such as distortion, swell or displacement of 6kV and above transformer are measured by detecting amplitude-frequency response characteristics of each winding, not requiring lifting of transformer enclosure or disintegration.
2) Quick measuring, measuring of a single winding is within 2 minutes.
3) High frequency accuracy, higher than 0.001%.
4) Digital frequency synthesis, with higher frequency stability.
5) 5000V voltage isolation fully protects safety of the testing computer.
6) Able to load 9 curves at the same time and automatically calculate parameters of each curve and diagnose winding deformations to provide the reference diagnosis conclusion.
7) Analysis software has powerful functions and software and hardware indicators satisfy national standard DL/T911-2016.
8) Software management is humanized with high degree of intelligence. You only need to click a key to complete all measurements after setting of parameters.
9) The software interface is concise and vivid, with clear menus of analysis, save, report export, print, etc.
2.Main Technical Indicators
1) Measuring speed: 1 min- 2 min for single-phase winding
2) Output voltage: Vpp-25V, adjusting automatically in test
3) Output impedance: 50Ω
4) Input impedance: 1MΩ (the response channel is built with 50Ω matching resistance)
5) Frequency scan scope: 10Hz-20MHz
6) Frequency accuracy: 0.001%
7) Frequency scan manner: linear or logarithmic, frequency sacn interval and number of sweep points are freely settable
8) Curve display: amplitude-frequency curve (phase-frequency curve, optional)
9) Width of measuring dynamic range: -120dB~20dB
10) Supply voltage: AC100-240V 50/60Hz (use DC12V Adapater recommend)
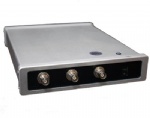
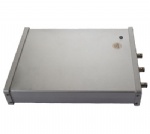
11) DIM: 238mm*184mm*40mm
12) Net weight:2.45Kg
3.Main Features of Test Analysis Software
1) Use windows platform compatible with Window 2000/Window XP/Windows 7/windows 8.
2) Use database to save test data and render concise and easy data management.
3) Able to load 9 curves at the same time and automatically calculate parameters of each curve and diagnose winding deformations to provide the reference diagnosis conclusion.
4) Software management function is powerful that takes into full account of site use demand. Measuring data is automatically saved and exported to form Word version test report (require installation of relevant Office software) or JPG photo report to facilitate the user to export test report.
5) The software has distinctive humanized feature. Measuring conditions are mostly options, which exempt the need of many inputs and bring about easier operation.
6) The software has high degree of intelligence. You only need to click a key to complete all measurements after connection of input and output signals.
7) The software interface is concise, vivid and practical.
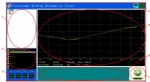
The software main interface consists of 7 parts:
(A)Test Curve Display Area
The area displays test curve with frequency as X-coordinate and dB value with Y-coordinate (amplitude-frequency test) or angle value (phase-frequency test). The label below consists of:
Curve type label: to mark the current display is "amplitude-frequency curve" or "phase-frequency curve". Click the label to switch between the two types (require hardware support).
Scanning mode label: to display the current scanning mode is linear scanning or logarithmic scanning. Click the label to switch between the two modes.
Start frequency label: to display start frequency of current scanning. Click the label to switch among different start frequencies.
Stop frequency label: to display stop frequency of current scanning.
Scanning point number label: to display total point number of current scanning. Click the label to switch among different point numbers.
(B)Status Display Area
The status display area displays working status of the current equipment.
(C)Operating Zone
There are two keys in the operating area, start and stop that display in turn according to service status, i.e. "start" displays under stop status and "stop" under start status.
There is a current status display label under the key to display current status of the tester:
"Offline status": computer is working under off-line status, when only data reading and printing functions are available.
"Equipment connected": computer is connected with equipment and testing is possible.
"Equipment disconnected": computer is disconnected with equipment and testing is impossible, generally requiring reconnection and restart of software.
(D)Test Parameter Setting Area
Area D displays parameter setting window that is used for setting of test parameters, including winding wiring method, category and number of the winding to be tested, scan stop frequency, etc.
(E)Curve Description Area
Area E displays description information of the current curve. The label in a color contains description information of its corresponding curve in the same color.
(F)Data Selection Area
What locates at the top right corner (F) is data selection area. Test data applies hierarchical management, where the first grade is name of substation, the second grade name of transformer, the third grade category and number of transformer winding and the last grade existing data. Data name is displayed in the manner of "data type @ test time". Data displayed in the part matches with content of the label in area (A). When "amplitude-frequency curve" is displayed, the data selection area displays test result of the amplitude-frequency curve and when "phase-frequency curve" is displayed, the data selection area displays test result of the phase-frequency curve.
When "amplitude-frequency curve" or "phase-frequency curve" is displayed, the test result is displayed in area A when relevant data is clicked.
(G)Function Key Area
Keys in the function key area (G) will switch automatically and display dynamically based on the use function.
"DSA analysis": used for correlation analysis.
|
 0.1Hz VLF AC/DC Hipot tester